Where is the most expensive real estate in the United States? It depends on how you look at it. Using home sale prices and data from the state-level, the answer is Hawaii with a median price of $547,600 per home. However, at a neighborhood level, the answer could be very different. For example, the most expensive neighborhood by median housing price is Presidio Heights in San Francisco ($7 million+ homes in January 2017), and the most expensive neighborhood for rent is West Village in New York City ($6,030 per month for a 1,000 sq. ft place). Both of these approaches have significant drawbacks. Using state-level data is too broad, and doesn’t account for any distinction between urban/rural areas. Meanwhile, zooming in on a neighborhood is interesting and thorough, but it may be too granular for most purposes. People have a mental picture of San Francisco as a whole, but fewer will be familiar with the nuances of specific neighborhoods like Presidio Heights, Nob Hill, or the Mission District.
A Common Denominator?
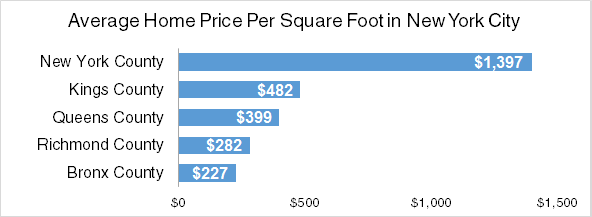
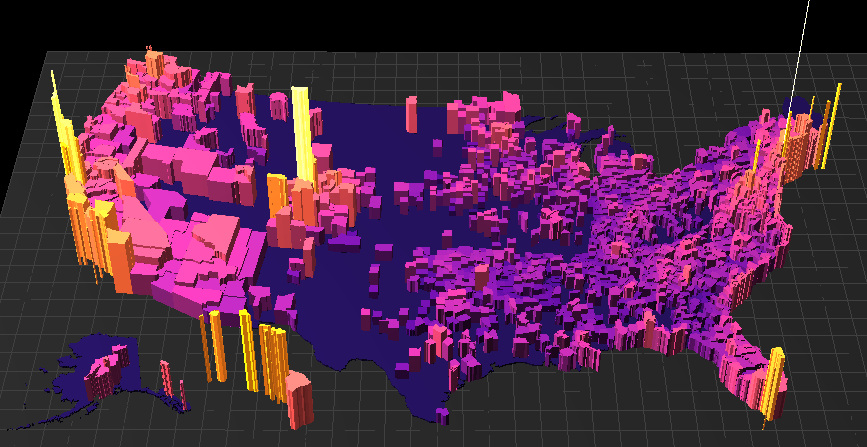
A county-level analysis may be the easiest to understand, and by using average price per square foot we have a more universal denominator. After all, a house bought in Hawaii might be more expensive than a small loft in New York City – but it might also be 5x the size. The visualization above focuses in on price per square foot at the county-level – and the results are clear: New York, San Francisco, and Aspen (Pitkin County) stand out. As Max Galka from Metrocosm notes, New York is instantly recognizable:
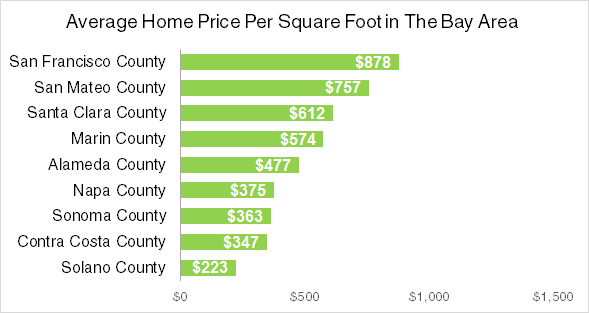
The Bay Area also stands out, thanks to the unprecedented boom in Silicon Valley over the last 15 years. San Francisco leads the pack because of its cultural appeal, but other places in the Valley are also extremely expensive, relative to anywhere else in America: [> Lastly, it is worth noting that Pitkin County in Colorado is one of the other three most expensive U.S. housing markets using this approach. The largest town in the county is Aspen, a popular ski destination, and the county averages a price per square foot of $841. on The good news is that the Federal Reserve, U.S. Treasury, and Federal Deposit Insurance Corporation are taking action to restore confidence and take the appropriate measures to help provide stability in the market. With this in mind, the above infographic from New York Life Investments looks at the factors that impact bonds, how different types of bonds have historically performed across market environments, and the current bond market volatility in a broader context.
Bond Market Returns
Bonds had a historic year in 2022, posting one of the worst returns ever recorded. As interest rates rose at the fastest pace in 40 years, it pushed bond prices lower due to their inverse relationship. In a rare year, bonds dropped 13%.
Source: FactSet, 01/02/2023.
Bond prices are only one part of a bond’s total return—the other looks at the income a bond provides. As interest rates have increased in the last year, it has driven higher bond yields in 2023.
Source: YCharts, 3/20/2023.
With this recent performance in mind, let’s look at some other key factors that impact the bond market.
Factors Impacting Bond Markets
Interest rates play a central role in bond market dynamics. This is because they affect a bond’s price. When rates are rising, existing bonds with lower rates are less valuable and prices decline. When rates are dropping, existing bonds with higher rates are more valuable and their prices rise. In March, the Federal Reserve raised rates 25 basis points to fall within the 4.75%-5.00% range, a level not seen since September 2007. Here are projections for where the federal funds rate is headed in 2023:
Federal Reserve Projection*: 5.1% Economist Projections**: 5.3%
*Based on median estimates in the March summary of quarterly economic projections.**Projections based on March 10-15 Bloomberg economist survey. Together, interest rates and the macroenvironment can have a positive or negative effect on bonds.
Positive
Here are three variables that may affect bond prices in a positive direction:
Lower Inflation: Reduces likelihood of interest rate hikes. Lower Interest Rates: When rates are falling, bond prices are typically higher. Recession: Can prompt a cut in interest rates, boosting bond prices.
Negative
On the other hand, here are variables that may negatively impact bond prices:
Higher Inflation: Can increase the likelihood of the Federal Reserve to raise interest rates. Rising Interest Rates: Interest rate hikes lead bond prices to fall. Weaker Fundamentals: When a bond’s credit risk gets worse, its price can drop. Credit risk indicates the chance of a default, the risk of a bond issuer not making interest payments within a given time period.
Bonds have been impacted by these negative factors since inflation started rising in March 2021.
Fixed Income Opportunities
Below, we show the types of bonds that have had the best performance during rising rates and recessions.
Source: Derek Horstmeyer, George Mason University 12/3/2022. As we can see, U.S. ultrashort bonds performed the best during rising rates. Mortgage bonds outperformed during recessions, averaging 11.4% returns, but with higher volatility. U.S. long-term bonds had 7.7% average returns, the best across all market conditions. In fact, they were also a close second during recessions. When rates are rising, ultrashort bonds allow investors to capture higher rates when they mature, often with lower historical volatility.
A Closer Look at Bond Market Volatility
While bond market volatility has jumped this year, current dislocations may provide investment opportunities. Bond dislocations allow investors to buy at lower prices, factoring in that the fundamental quality of the bond remains strong. With this in mind, here are two areas of the bond market that may provide opportunities for investors:
Investment-Grade Corporate Bonds: Higher credit quality makes them potentially less vulnerable to increasing interest rates. Intermediate Bonds (2-10 Years): Allow investors to lock in higher rates.
Both types of bonds focus on quality and capturing higher yields when faced with challenging market conditions.
Finding the Upside
Much of the volatility seen in the banking sector was due to banks buying bonds during the pandemic—or even earlier—at a time when interest rates were historically low. Since then, rates have climbed considerably. Should rates moderate or stop increasing, this may present better market conditions for bonds. In this way, today’s steep discount in bond markets may present an attractive opportunity for price appreciation. At the same time, investors can potentially lock in strong yields as inflation may subside in the coming years ahead. Learn more about bond investing strategies with New York Life Investments.